




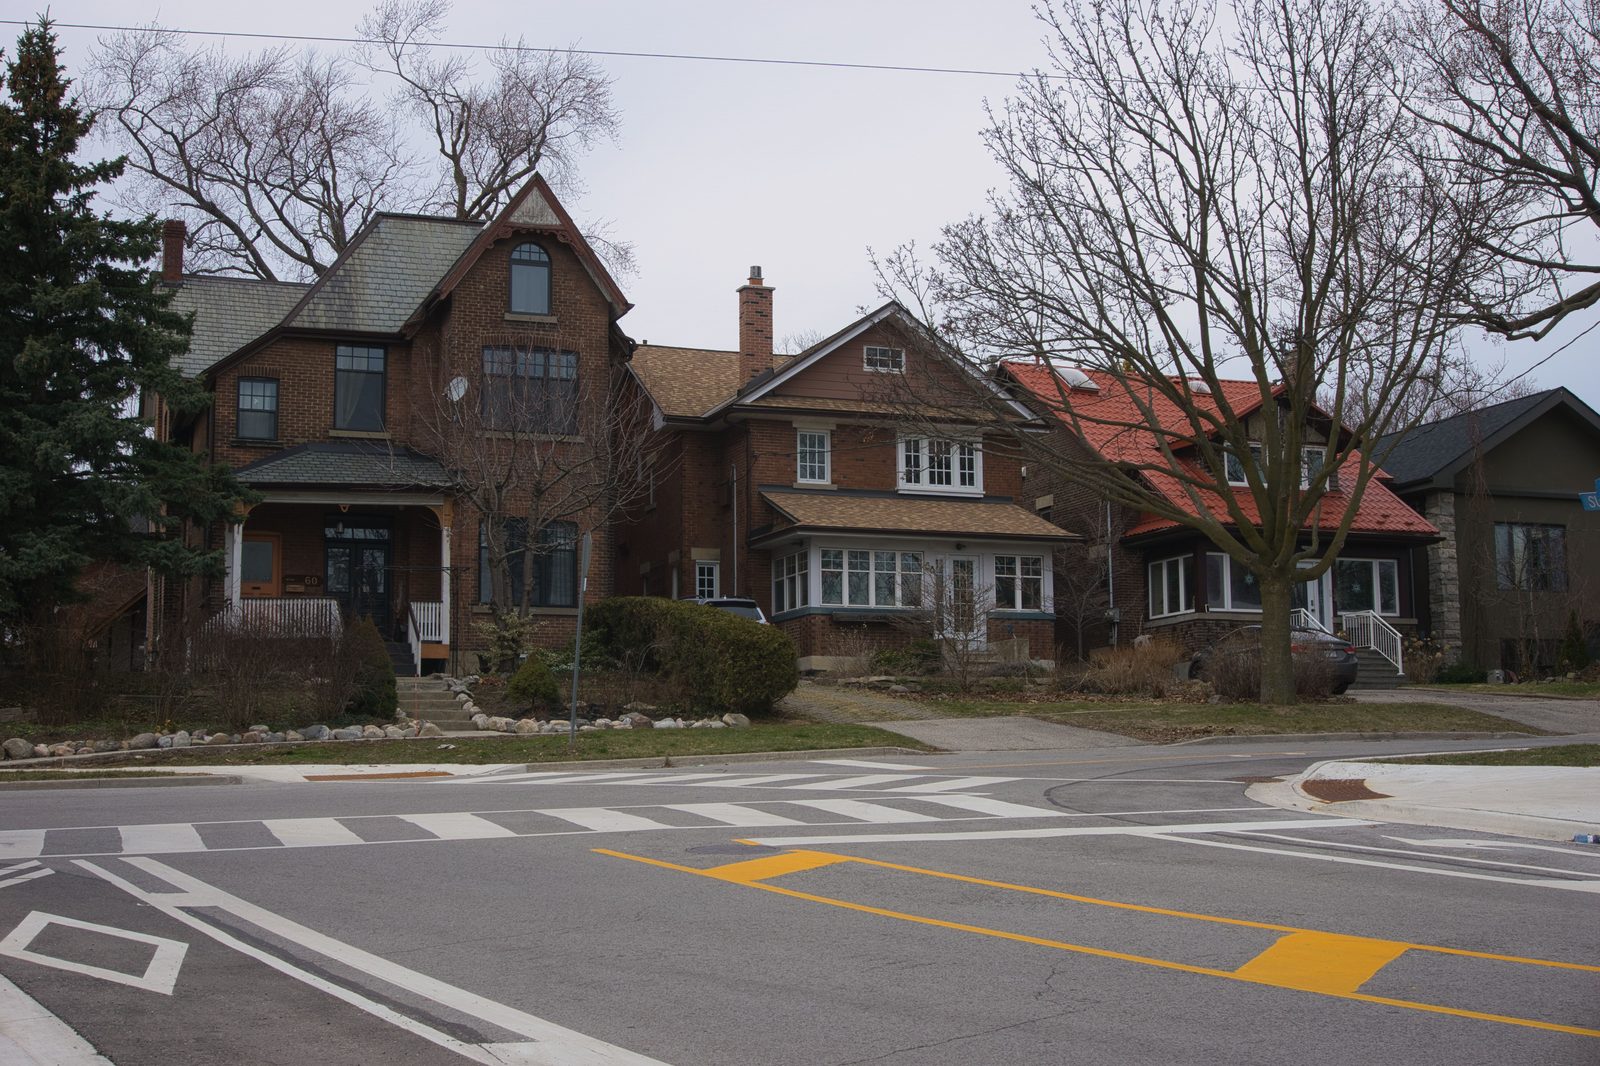
Canadian business news, Ontario home sales fell 8.7 percent in October 2026 to 14,053 units, while national sales dropped 10.6 percent, and prices kept sliding across every home type.
Ontario home sales fell 8.7 percent in October 2026 to 14,053 units, while national sales dropped 10.6 percent. The Ontario benchmark price fell 3.8 percent to 733,600 dollars, and the average resale price fell 3.5 percent to 801,634 dollars. With 4.9 months of inventory, buyers now have more choice and more room to negotiate.
By Maplestime Business Desk | Ontario, Canada | November 16, 2026
Sources: CREA Stats, Ottawa Real Estate Board | Last updated: November 16, 2026
Key Takeaways
- Ontario home sales totalled 14,053 units in October 2026, down 8.7 percent from October 2025, and 19.7 percent below the 10-year October average.
- The Ontario MLS Home Price Index composite benchmark was $733,600, down 3.8 percent year over year. Single-family homes were $812,100, townhouses $581,400, and apartments $480,100.
- The Ontario average resale price was $801,634, down 3.5 percent, and the total dollar value of Ontario sales was $11.3 billion, down 11.9 percent.
- Months of inventory in Ontario numbered 4.9, above the long-run average of 3.1. The national average price was $678,584, down 1.6 percent.
- Ottawa recorded 1,048 sales, down 10.7 percent year over year, with an average price of $678,512, down 4.5 percent.
How Far Did Ontario home sales Fall?
Residential sales reported through the MLS Systems of real estate boards in Ontario numbered 14,053 units in October 2026, a moderate decrease of 8.7 percent from October 2025. Home sales were 0.1 percent below the five-year average and 19.7 percent below the 10-year average for the month of October.
Nationally, home sales posted a large decline of 10.6 percent from year-ago levels in October 2026. Ontario is not an outlier here. It is part of a countrywide cooldown, and the province’s sales are now running well below what October used to deliver.
On a year-to-date basis, Ontario home sales totalled 136,751 units over the first 10 months of the year, down 3.8 percent from the same period in 2025. New listings fell too, down 8.8 percent from October 2025 to 33,510, but active listings still numbered 68,728 at the end of October. Supply is not flooding in, yet buyers still have plenty to choose from.
What Happened to Prices?
The MLS Home Price Index tracks price trends far more accurately than average or median price measures, and it points the same way as the sales figures. The overall composite benchmark price was $733,600 in October 2026, a reduction of 3.8 percent compared with October 2025.
Every home type lost ground. The benchmark price for single-family homes was $812,100, falling by 3.7 percent on a year-over-year basis. Townhouse and row units were $581,400, down 5.5 percent, while the benchmark apartment price was $480,100, down 6.6 percent from year-ago levels. Apartments, the entry point for many first-time buyers, took the biggest hit.
The average price of resale residential homes sold across the province in October 2026 was $801,634, down 3.5 percent from October 2025. The national average price, by comparison, marked a decline of 1.6 percent to $678,584. Ontario homes cost more than the national average, and they are falling faster.
What Does Ottawa Tell Us?
Ottawa’s housing market continued to lean in buyers’ favour in October, although modestly stronger sales and fewer new listings eased some pressure on sellers. A total of 1,048 residential properties sold through the MLS System in October, down 10.7 percent from October 2025 and up 3.8 percent from September.
The average residential sale price was $678,512 in October, down 4.5 percent from a year earlier and 1.0 percent from September. The median price was $622,000, down 3.9 percent year over year. Homes sold for an average of 97.5 percent of their listing price, unchanged from September, and the median time on market was 25.5 days.
“October brought some welcome relief for sellers, with a modest increase in sales and fewer new listings helping to ease some of the pressure we have seen in recent months,” said Tami Eades, President of the Ottawa Real Estate Board. “However, buyers continue to have considerable choice, and market conditions remain softer than a year ago.”
Months of inventory in Ontario numbered 4.9 at the end of October 2026, up from 4.7 months at the end of October 2025 and above the long-run average of 3.1 months. In Ottawa, months of inventory eased to 4.4 from 4.8 in September. Both figures point the same way. Buyers have time, sellers need patience, and pricing a home above the neighbourhood will cost weeks on the market.
What Should Buyers and Sellers Do Now?
For buyers, October was the friendliest month in a while. More inventory, falling prices, and sellers accepting 97.5 percent of asking price in Ottawa all add up to room to negotiate, especially on apartments and townhouses where prices fell fastest. The catch is borrowing costs. The Bank of Canada raised its policy rate to 2.5 percent on October 28, the first increase in three years, and that will shape what buyers can actually afford.
For sellers, the message is blunt. The market no longer rewards optimism. Recent sales and competing listings in the same neighbourhood are essential to setting realistic prices, and October’s data shows that homes priced to the market still sell in about 25 days in Ottawa. Homes priced on last year’s numbers will sit.
Heading into winter, employment uncertainty, borrowing costs and housing policy will keep shaping buyer confidence. For now, though, the direction is clear. Ontario’s housing market belongs to buyers, and sellers who accept that early will do better than those who wait for a rebound that October gave no sign of.
Frequently Asked Questions
How many homes sold in Ontario in October 2026?
Ontario home sales totalled 14,053 units, down 8.7 percent from October 2025 and 19.7 percent below the 10-year October average.
What is the benchmark home price in Ontario?
The MLS Home Price Index composite benchmark was $733,600 in October 2026, down 3.8 percent year over year.
How long would it take to sell current Ontario inventory?
Months of inventory numbered 4.9 at the end of October 2026, above the long-run average of 3.1 months.
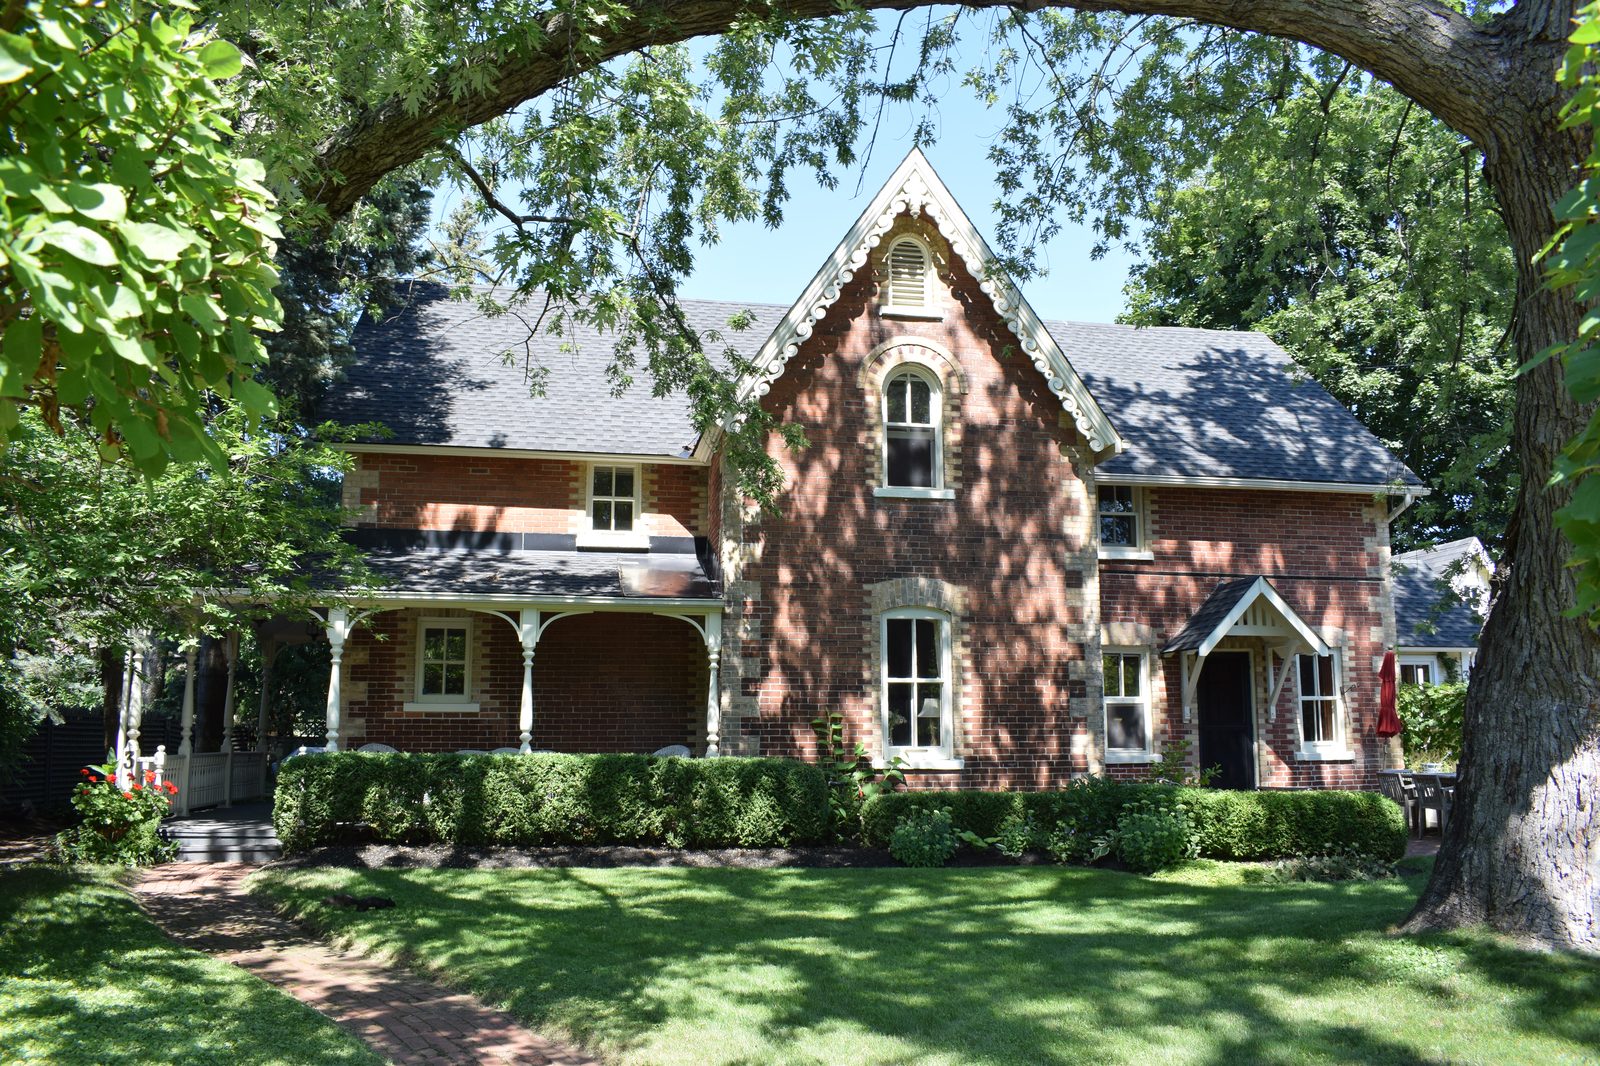
Maplestime will provide updates from the Ontario housing market as announcements are made.
Have a tip about Ontario home sales? Email [email protected]
Have a correction? Email [email protected]
Do you think Ontario home prices still have further to fall, or is this the buying window buyers have been waiting for? Tell us in the comments. And share this with every Canadian watching house prices in Ontario this fall.
Enjoying Maplestime? Support independent Canadian journalism — no paywall, no corporate owners.